
Extreme heat is a silent killer, and one we continue to underestimate. The thermometer at Central Park might read 100°F, which is dangerous enough, but step onto the street or into a sunlit apartment in Harlem or any other major city, and depending upon the humidity level, the felt temperature can soar past 130°F.
This alarming disconnect between reported and experienced temperatures has real consequences. This summer alone, deadly heatwaves have claimed lives across Spain, France, Italy, Texas, Greece, and New York. Yet, many of the resulting deaths are missing from official counts, and the temperatures that caused them are often misreported.
Extreme heat is no longer a future threat. It’s here. It’s deadly. And it remains dangerously misunderstood.
A Study Rooted in Urgency
This disconnect between official data and lived experience prompted a collaborative effort to uncover the real face of urban heat. The Open Geospatial Consortium (OGC), with support from the United States Geological Survey (USGS), the National Oceanic and Atmospheric Administration (NOAA), and Natural Resources Canada (NRCan), has been leading pilot projects to explore how maps and location data can improve disaster preparedness and response.
One such effort, proposed by the New York City Geospatial Information Systems and Mapping Organization (NYC GISMO), focused on the dangers of extreme heat in dense urban areas. Alarmed by the deadly toll of summer heatwaves in New York, GISMO brought together experts from HSR.health, the U.S. Department of Energy (DOE), NOAA, Safe Software, Inc., and Navteca, Inc.
The pilot centered on a highly urbanized section of Harlem, just north and east of Central Park. The goal was to understand how heat is measured and mapped, assess its health impacts, and determine whether risks could be identified at the building level (Figure 1).
What the Research Revealed
Felt Temperatures Are Far Higher Than Official Readings
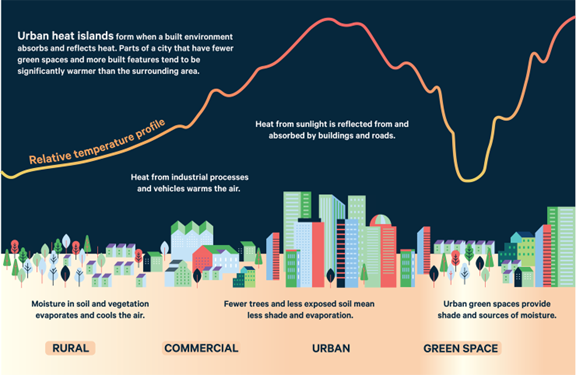
Official temperatures are usually recorded in shaded areas like parks, away from heat-retaining surfaces. But people do not live in parks, but in buildings made of concrete and bricks, surrounded by asphalt, stone, and concrete streets, where the sun’s energy gets trapped. The result is the urban heat island effect (UHIE), which can raise felt temperatures by as much as 30°F or more, beyond official readings.
Where Is It the Hottest?
The hottest temperatures are found at street levels and inside residences with unshaded southern facades or top floor units which receive maximum sun exposure. These buildings absorb and retain heat and do not cool down at night. Vulnerable neighborhoods – typically low-income areas with fewer trees, and parks, and far from cooling water bodies – face the most persistent heat, making residents more susceptible to heat-related illness and death.
The Hidden Pattern of Heat-Induced Deaths
Historical data from cities like Paris (2003), Chicago (1995), and Vancouver (2021) shows that extreme heat becomes deadly only after several consecutive days of high temperatures. Death rates remain stable at first, but after three or more days without relief, there is a sharp spike in mortality. This indicates that both duration and intensity of heat matter.
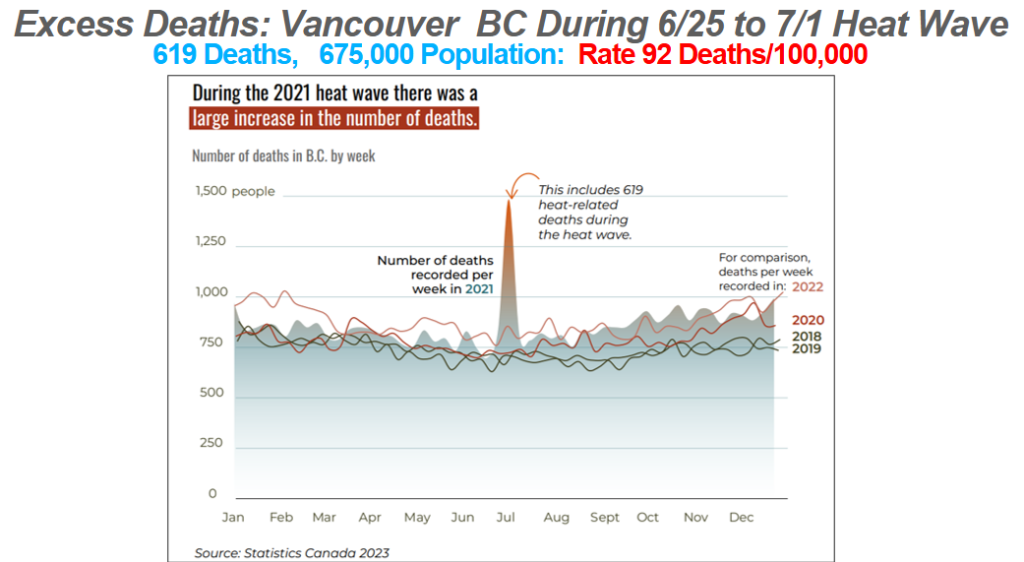
2021 Vancouver Heat Death Spike
Who Is Most at Risk and Why So Many Heat Deaths Go Uncounted
Those most vulnerable to extreme heat include young children, the elderly, people with pre-existing health conditions, outdoor laborers, and individuals without consistent access to air conditioning or other cooling resources.These groups face a higher risk of serious illness or death during prolonged heat events, especially when living in overheated homes or neighborhoods with limited green space.
Yet in cities like New York, heat-related deaths are counted only if a medical examiner explicitly identifies heat as a cause. In reality, heat often triggers death by severely exacerbating heart, pulmonary, renal, and other pre-existing chronic conditions, but these are rarely attributed to heat in official records. As a result, many heat induced deaths go uncounted.
The best way to tabulate heat deaths is to calculate excess deaths above the expected number of deaths during average summer temperatures, as is done in Europe and in several U.S. cities including Chicago. Cities that do not take this approach risk severely undercounting heat related deaths by 75% or more.
How Cities Can Cool Down
There are a number of well-known strategies to mitigate the UHIE and to ensure that residences are cool enough to live in. For instance:
- Painting rooftops with reflective paint.
- Making building facades and streets more reflective.
- Increasing green vegetation like trees and other plantings to help control temperatures at ground level.
- Using low-e windows that reflect sunlight.
- Building interiors with better insulation and air conditioning.
Public cooling centers are also critical, especially for households that lack air conditioning or avoid using it due to high electricity costs. A report by the former New York City Comptroller Brad Lander estimated that 11% of New York’s population does not have access to AC in their homes, the equivalent of more than 900,000 people!
One possible approach could be to explore measures that ensure building owners keep indoor temperatures below a maximum level in the summer, similar to existing laws that require owners to maintain temperatures above a minimum temperature in the winter.
Worst Case Scenario
It is incumbent on the government and utility providers to ensure that the electric grid can handle the growing demand for air conditioning during extreme heat events. Maintaining indoor thermal comfort is not a luxury, but a necessity for survival. Should there be an extended power outage during a heatwave, the loss of cooling could lead to a dramatic surge in heat-related deaths and illnesses, potentially reaching catastrophic levels.
Mapping Tools That Can Help Cities Prepare and Respond
Much of the information above was aided by maps and location data, which is essential for understanding how extreme heat affects urban areas, identifying who is at most risk and informing targeted interventions. The OGC pilot demonstrated how geospatial tools can play a central role in both immediate response and long-term planning.
Anticipating Extreme Heat Events
The U.S. National Weather Service (NWS) provides advance warnings about extreme heat using data from satellites, weather balloons, and ground stations. These forecasts help cities prepare for high temperatures. However, research must continue to improve current methods and technologies to make forecasts even more accurate, timely, and granular.
Mapping Green Spaces and Shade
The urban heat island effect is at its worst in densely built-up neighborhoods with few green spaces. It is now possible, using aerial photography and street surveys, to calculate the amount of tree shade available on a block-by-block basis. This information can help governments to direct tree planting efforts to those streets in greatest need of more shade. It can also help developers plan new cityscapes that minimize contribution to the UHIE.
Locating Cooling Centers
Cities around the world are increasingly providing cooling centers to shelter people who do not have access to air conditioners. Such cooling centers must be located in areas where people are most vulnerable and lack air conditioning. Mapping tools can help identify these neighborhoods down to the Census tract level, ensuring that cooling centers are accessible by public transit and available 24X7 as overheated apartments remain just as dangerous during the night as during the day.
Mapping Urban Heat Patterns
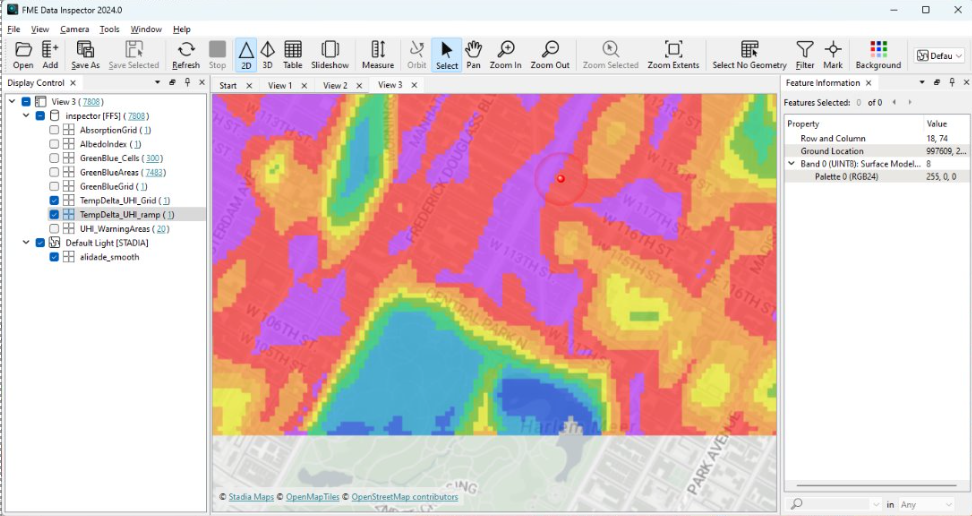
The OGC pilot used data such as satellite and sensor-based temperature readings, land surface reflective characteristics, vegetation density, and proximity to water bodies to model how heat builds and lingers in different parts of the city. This information when modelled and overlaid on New York City’s base map allowed the creation of an estimated heat grid exemplified by the map below in Figure 4.
Safe Software’s FME platform was used to create this heat grid for northern Manhattan. The same method can be adapted for other cities. HSR.health also developed a Heat Health Risk Index based on projected temperatures within a census tract and then calculated the number of vulnerable individuals in each tract to estimate the possible number of excess deaths, hospitalizations, and illnesses. This tool can help local governments plan where to focus resources before and during extreme heat events and assist in the development of heat mitigation strategies.
Using 3D Mapping to Identify Heat-Exposed Buildings
Many cities now have the ability to map buildings in 3D. OGC’s CityGML data model enables detailed representations of cityscapes, including building orientation and height. These models can show which apartments are most exposed to the sun and would likely suffer from significant heat buildup. The same technique can be used to identify streets where the greatest buildup of heat takes place. (See Figure 1 above: 3D heat map of Harlem developed by Navteca Inc.) This information can guide outreach to at-risk households and support local check-in efforts during heatwaves.
Personal Heat Sensing Technologies
We are living in a time that is seeing the proliferation of low-cost sensors and the widespread use of smart phones. It is reasonable to imagine that in residences considered at high risk of dangerous temperatures, heat sensors can be installed and linked to smart phones. When temperatures approach a threatening level, sensors can trigger automatic calls to emergency responders, neighbors, or relatives, to check on the condition of residents, dispatching an ambulance if necessary.
Conclusion
The OGC pilot showed that public agencies and health departments often lack a full picture of extreme heat impacts. Official temperature readings do not reflect what residents experience at street level or inside overheated homes. And without accurate data, many heat-related deaths go unnoticed.
At the same time, we also learned that important work is underway across cities to reduce the urban heat island effect. With the growing availability of geospatial tools, sensor technologies, and data integration platforms, cities now have better ways to understand heat risk and take targeted action.
We expect that improved forecasting, real-time sensing, detailed heat maps, and 3D building models can help local governments plan more effective cooling strategies, identify the most vulnerable communities, and deploy resources where they are most needed. With smarter use of data, we can help cities protect their residents, prevent avoidable deaths, and prepare for a hotter future.
For more information see the OGC Climate and Disaster Resilience Pilot 2024 Engineering Report.
Study Participants
Alan Leidner, NYC Geospatial Information Systems and Mapping Organization
Jiin Wen, NYC Geospatial Information Systems and Mapping Organization
Ajay K Gupta, CEO, HSR.health.
Paul A Churchyard, CTO, HSR.health.
Joel Klein, U.S. National Oceanic and Atmospheric Administration
Dr. David Green, Director, S&T Innovation, Green Resilience Insights
Dr. Bandana Kar, AAAS STP Fellow @ U.S. Department of Energy
Dean Hintz, Safe Software, Inc.
Dr. Josh Lieberman, Harvard University, Center for Geographic Analysis (CGA)
Theo Goetemann, President, Basil Labs, Inc.
Shayna Solis CEO, Navteca LLC
Adam Silcott, Lead Developer, Navteca LLC
Special Thanks
The work of the Extreme Heat team was greatly enhanced by the following organizations and studies:
- NOAA/CAPA’s 2021 Study of North Manhattan and the South Bronx: OSF | Heat Watch Bronx-Manhattan_Report_111021.pdf
- Climate Central’s Study of Urban Heat Hotspots: Urban Heat Hot Spots | Climate Central